How do you build useful reports in Attio?
By Daniel Hull ·
Useful reports start before you ever open the reporting tab. They start with how you design your attributes. If your pipeline stages are messy or your deal values aren't captured consistently, no report will save you.
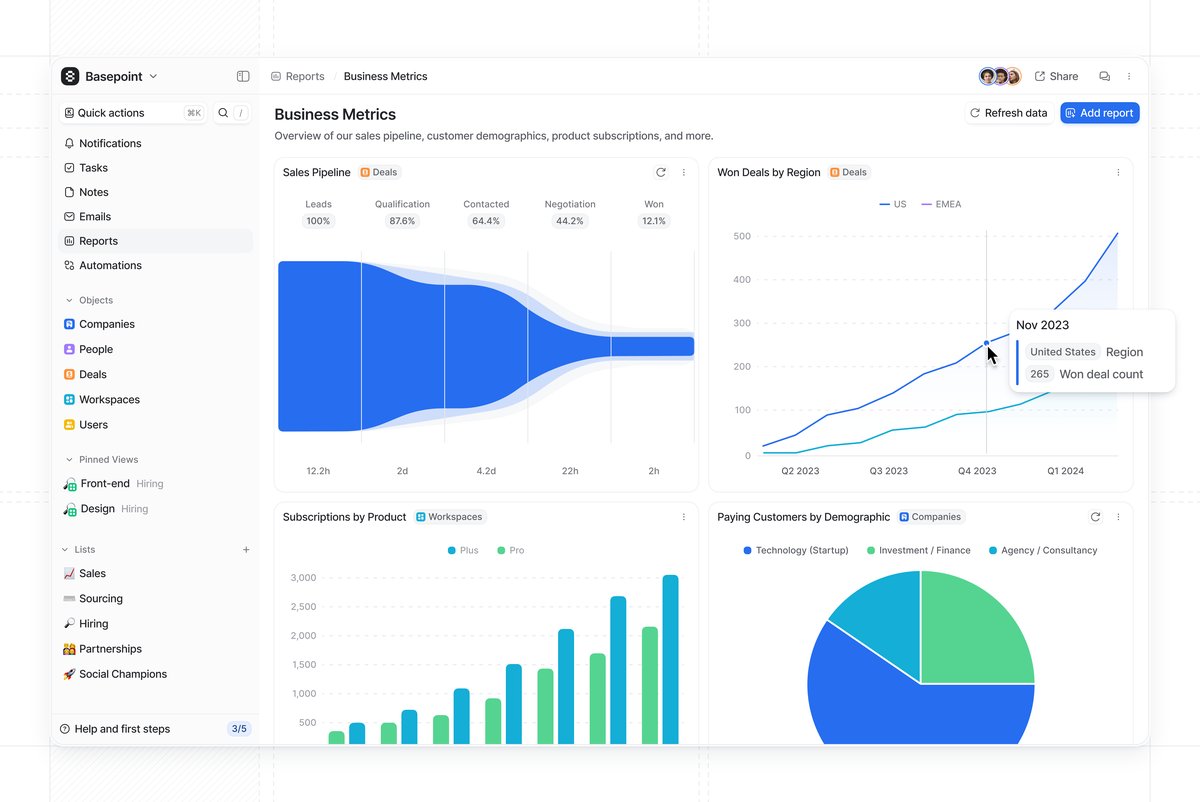 An Attio reporting dashboard combining pipeline metrics, regional trends, and customer demographics.
Understanding report types
Attio gives you five report types: insight reports (point-in-time snapshots), historical values (trends over time), funnels (stage-to-stage conversion), time in stage (how long records sit in each phase), and stage changed (records entering a stage within a window). Each one lives on a dashboard, and you can combine multiple reports on a single dashboard to build a view that actually tells a story.
The reports I set up most often for clients fall into three categories.
Pipeline, activity, and value reports
Pipeline reports are the foundation. An insight report grouped by your deal stage status attribute shows you where deals are sitting right now. Pair that with a funnel report across those same stages and you can see where deals are falling out. Add a time in stage report and you'll spot bottlenecks -- if deals spend three weeks in "Proposal" but two days in every other stage, that tells you something specific about your process.
Activity reports track momentum. A stage changed report filtered to a time window shows you how many deals entered each stage this week or month. This is more useful than a static pipeline count because it reveals whether your pipeline is actually moving or just accumulating.
Value reports need currency attributes to work. Once you have a currency attribute on your deals, you can measure total pipeline value by stage, average deal size, and value won over time. Without that attribute in place, you cannot report on value at all -- which is why attribute design matters so much. If you're using calculated attributes, you can also build weighted pipeline values and derived metrics that feed directly into these reports.
Designing attributes that make reports work
This is where most teams go wrong. They build reports and then wonder why the data looks incomplete or unreliable. The problem is almost never the report configuration. It is the attributes feeding the report.
Here are the attribute design rules I follow for reportable data:
Every deal needs a currency attribute. If you want to report on revenue, pipeline value, or average deal size, every deal must have a value. I recommend making this field required for deals past the qualification stage. A pipeline report that shows 40 deals worth $0 is useless. See capturing deal values on a pipeline for the full setup.
Status attributes need clean, consistent stages. If your pipeline has stages called "Interested," "Warm Lead," and "Qualified Lead" and nobody agrees on the difference, your funnel report will show meaningless conversion rates. Keep stages distinct and sequential. Each stage should have a clear entry criteria that your team can apply consistently.
Date attributes enable time-based reporting. A Close Date on deals lets you report on deals won by month or quarter. A Created Date (which Attio tracks automatically) feeds into pipeline velocity analysis. If you add a "Qualified Date" that gets set when a deal moves past qualification, you can calculate time-to-qualify as a metric.
Select attributes enable segmentation. A Deal Type select (New Business, Expansion, Renewal) lets you break down every pipeline report by deal type. A Lead Source select lets you compare which channels produce the best deals. Without these attributes, your reports show aggregate numbers that hide the patterns you need to see.
Actor reference attributes enable ownership reporting. An "Owner" actor reference on deals lets you report on pipeline by rep, win rate by rep, and activity by rep. This is foundational for sales management and coaching.
Building your first dashboard
The practical advice I give clients: start with three reports on one dashboard. Current pipeline by stage, conversion funnel, and deals won this month. Resist the urge to build ten reports on day one. You will not look at them, and they will go stale.
Here is the exact setup I recommend for a first dashboard:
Report 1: Current Pipeline by Stage. An insight report on your Deals object, grouped by the pipeline status attribute. Add the currency attribute as a metric so you see both deal count and total value per stage. This is your "state of the world" view. It answers "what does our pipeline look like right now?"
Report 2: Conversion Funnel. A funnel report using your pipeline status attribute. This shows you what percentage of deals that enter each stage make it to the next one. The stage with the biggest drop-off is where your process is breaking. Focus your coaching and process improvement there.
Report 3: Deals Won This Month. A stage changed report filtered to your "Closed Won" stage and the current month. Add the currency attribute as a metric. This tells you how much revenue you have closed this month and how many deals contributed to it.
Those three reports on one dashboard give your leadership team everything they need for a weekly pipeline review. Once this dashboard is established and your team is actually reviewing it weekly, add more.
Reports for different audiences
Not everyone needs the same dashboard. The reporting needs of a sales leader, an individual rep, and a CEO are different, and trying to serve all of them with one dashboard produces something that serves none of them well.
Sales leadership dashboard. Pipeline by stage (with value), conversion funnel, deals won this period, and time in stage. Add a pipeline by owner breakdown if you have multiple reps. This dashboard drives the weekly pipeline review meeting.
Individual rep dashboard. My deals by stage, my deals won this period, and my stage changed activity (how many deals did I move forward this week). Reps need to see their own performance, not the team aggregate. Filtering reports by the owner actor reference attribute gives each rep a personal view.
Executive dashboard. Total pipeline value, deals won (value and count) by month over time, and conversion rate trend. Executives want to see trajectory, not operational detail. A historical values report showing pipeline value over the last six months gives them that.
CS and renewals dashboard. If you track customer renewals, build a dashboard showing upcoming renewals by month, renewal risk distribution, and expansion pipeline. This gives your CS team a forward-looking view of their book of business.
Common reporting mistakes
Building reports before cleaning up attributes. If half your deals are missing values, your reports show half the picture. Run a data quality audit before you build reports. Filter your deals to show records missing the currency attribute, missing a close date, or stuck in a stage for more than 30 days. Fix the data first, then build the report.
Reporting on too many things. Three focused reports that your team reviews weekly are infinitely more valuable than fifteen reports that nobody opens. Every report on a dashboard should answer a specific question that leads to an action. If you cannot name the question and the action, the report does not belong there.
Ignoring the pipeline hygiene problem. The most common issue I see is a pipeline report that shows 200 deals worth $5M, but when you look closely, 80 of those deals have not been updated in three months. They are dead but nobody has moved them to Closed Lost. Your pipeline report is only as accurate as your team's discipline in keeping deal stages current. Build a workflow that flags stale deals so your pipeline stays clean.
Not using filters effectively. Attio lets you filter reports by any attribute on the object. Use this aggressively. A pipeline report filtered to "New Business" deals tells a different story than the same report including renewals. A conversion funnel filtered to a specific lead source shows you which channels actually convert. The aggregate view is a starting point. The filtered views are where insights live.
Confusing snapshots with trends. An insight report tells you where things stand today. A historical values report tells you if things are getting better or worse. Both matter, and they answer different questions. If your pipeline snapshot looks healthy but your historical trend shows pipeline value declining for three months, you have a problem that the snapshot alone would not reveal.
Extending beyond built-in reports
Where Attio's reporting has limits, be honest about them. If you need deeply custom calculated metrics or multi-object joins, you may need to push data to an external tool. But for pipeline visibility, conversion tracking, and activity monitoring, the built-in reports do the job well -- provided your attributes are set up to support what you want to measure. The reports can only be as good as the data model underneath them.
For teams that outgrow built-in reporting, the path is usually to sync Attio data to a data warehouse and build dashboards in a BI tool like Metabase, Looker, or Mode. This gives you the flexibility of SQL-based reporting with Attio as your system of action. The key is to keep Attio as the place where your team works and takes action, even if the deep analytics live elsewhere.
Calculated attributes can bridge some of this gap. If you need a derived metric like "weighted pipeline value" (deal value multiplied by stage probability), you can create a calculated attribute that computes this and then report on it natively in Attio.
For a broader view of how reporting fits into your overall CRM motion, see how to build a go-to-market engine in Attio. Your data model determines what questions you can answer, and your reports should map directly to the questions your team asks in their weekly reviews. And check Attio Help Center for the latest on report types and configuration options.